Impact Mapping with Graphviz
I took a collaborative product planning technique and of course had to formalize it with code...
 Image: Patrick Perkins
So I’ve turned on terminator vision lately while I try to locate the absolute unicorn of opportunities to prioritize in our product backlog. I’ve turned this into a borderline obsession now, after reading Kathy Sierra’s Badass: Making Users Awesome. What is the absolutely smallest improvement that can have the greatest impact?
No, really, WHAT IS IT?!
A colleague of mine recently turned me onto a process that potentially gets me closer to that answer: Impact Mapping. I’ll let the creator, Gojko Adzic, explain the process in detail in his highly recommended book. The key factor here is that the collaborative process involves building a graph or a tree from which the smallest yet most impactful items can be recognized. In other words, you can visualize what is valuable and very importantly, things that are not. Suddenly, everyone sees the loudest and most highly paid individual’s “must-have” idea orphaned on a dead tree branch with wilting leaves. The concept of graphing value as dependencies (because I live for scalable dependency management) is highly appealing to the engineer in me since my IDE these days is Google Slides 🙄.
Without getting too deep into the methodology of drawing impact maps, let’s state that the map starts with a measurable product or company objective. The next level down includes the actors: the direct practitioners or indirect influencers that affect this goal, what actions they perform or impact that is created through their behavior, and what we need to deliver to enable (or in some cases secure against) those impacts.
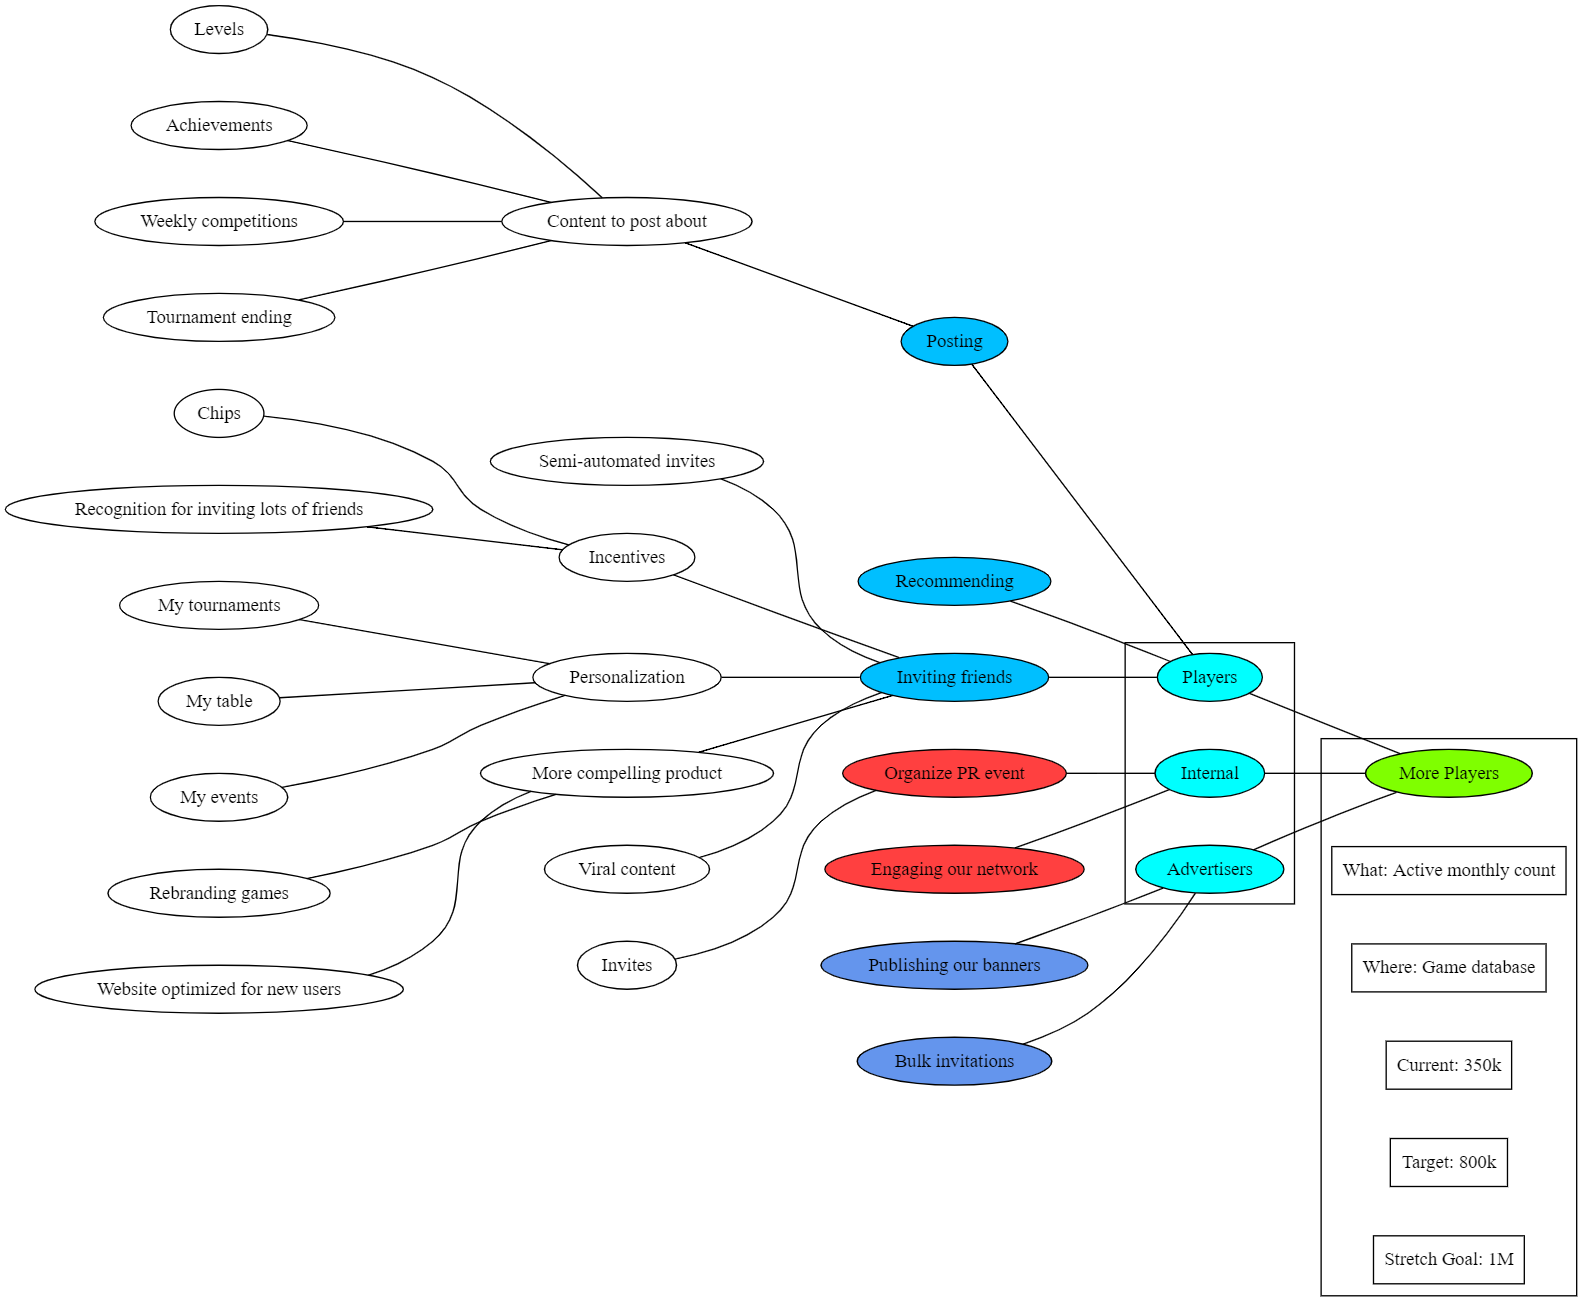
Great - here is a possible impact map (using an example from the book), with success measurements, in Graphviz-compatible dot format:
1 | graph { |
…and here is the rendered graph. The dot file can be checked into a project repository as source code, to be updated if new information is received or requirements change.
Obviously, more work can go into arranging the components for a more pleasing layout, such as the example provided by the author:
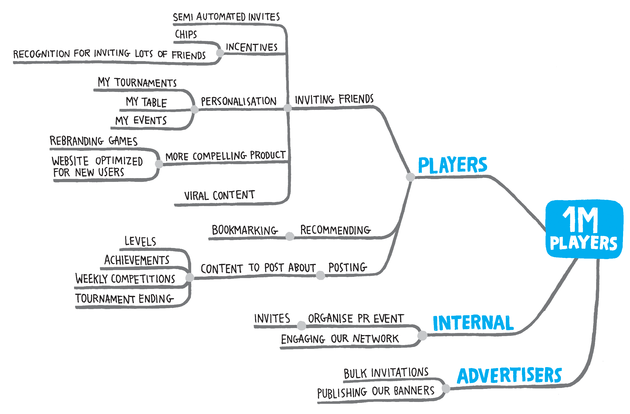 Image: https://impactmapping.org
…but I hope to continue exploring this Graphviz use case to further the application of structured data visualization to product management tooling.